")
RAP in Europe
On November 7, the EuroRAP General Assembly took an historic step and unanimously voted for the dissolution of the EuroRAP entity. After 21 years of existence, the RAP programme in Europe is now being integrated into iRAP, the International Road Assessment Programme.
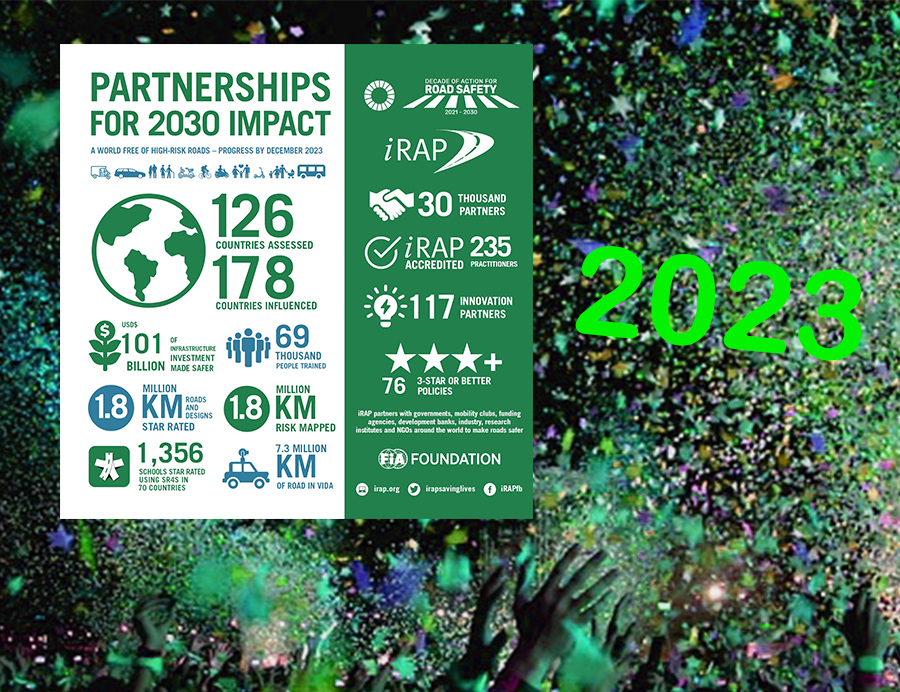
EuroRAP members have been instrumental in laying the foundation and inspiration for the Global Programme, which is now active in nearly 130 countries.
Today, with this integration, RAP partners across Europe will benefit from having a streamlined administration and a more productive use of donor and partner resources.
The integration does not affect how you can make use of the iRAP tools, methodology, and resources which are already in extensive use across the region. These will remain freely available, as they currently are worldwide, for the benefit of all in road safety. Most importantly, the integration leverages iRAP’s well-established organizational structure, shaped around innovation and development, programme support, and delivery of strategic projects.

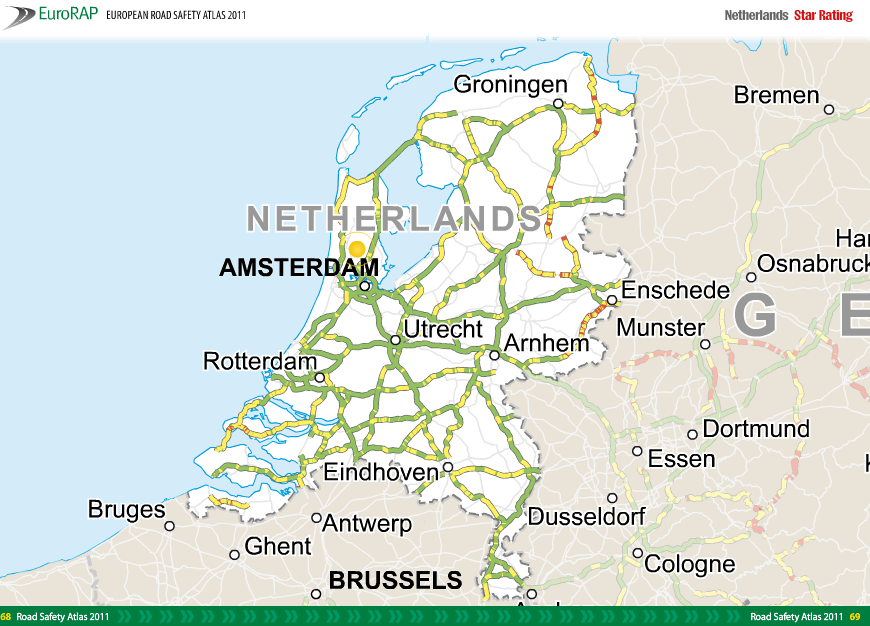
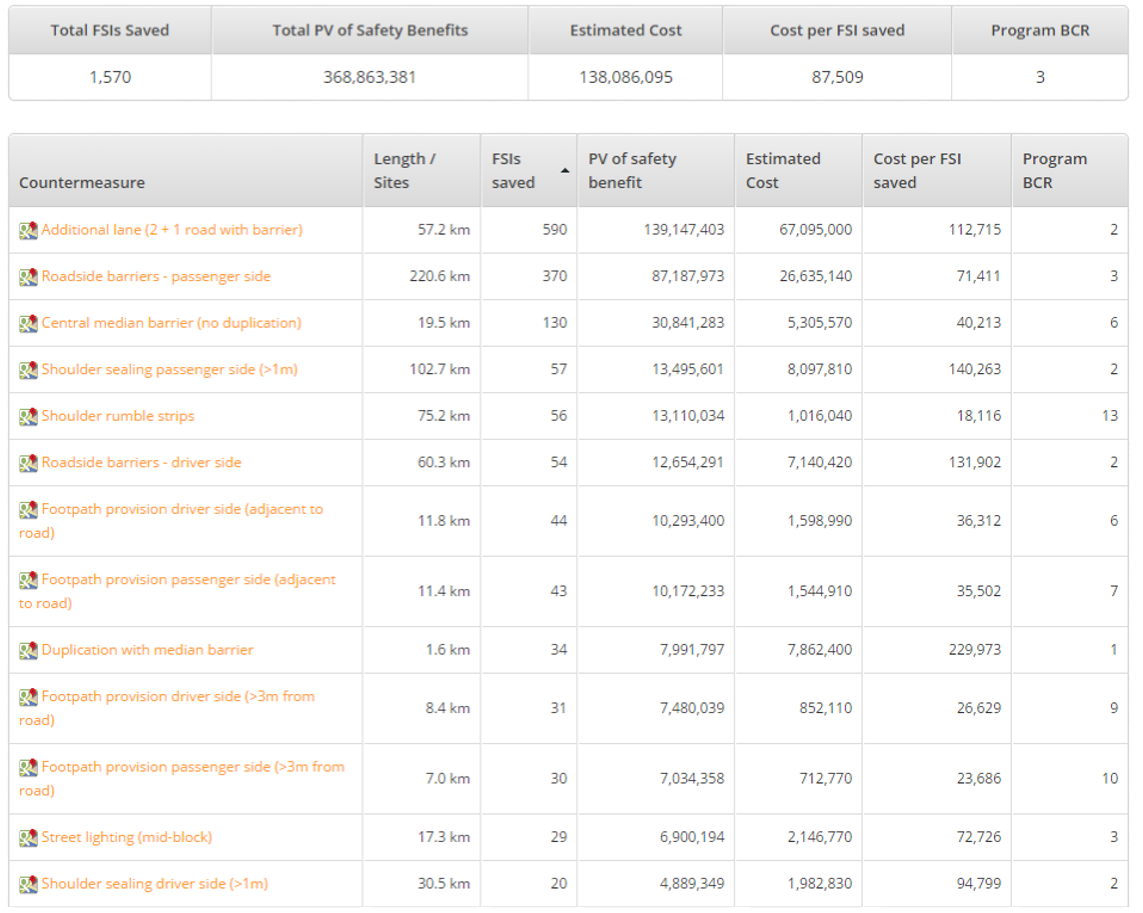
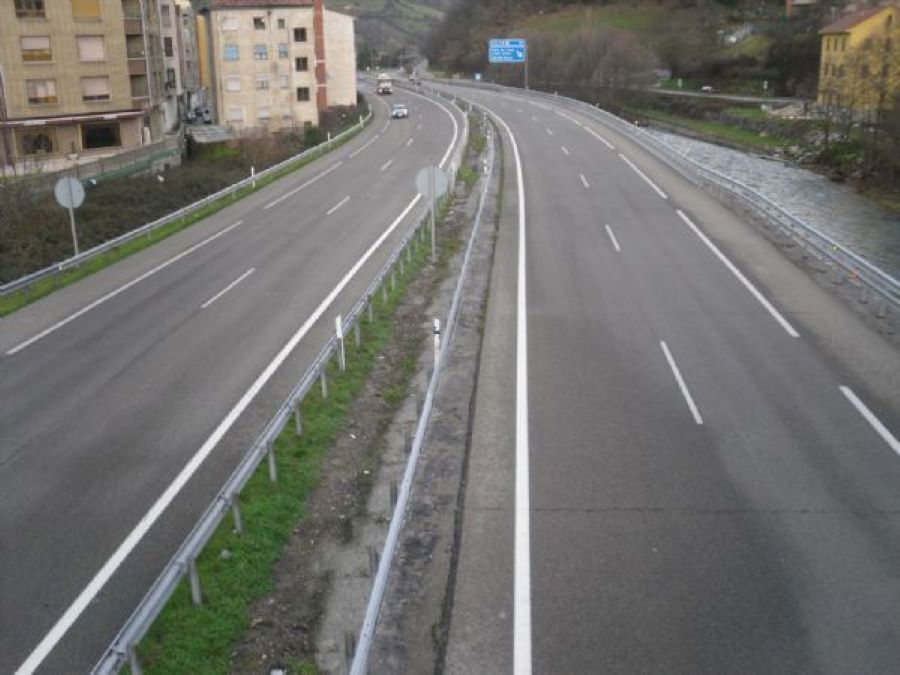
How safe are Europe’s roads and the Business Case for Safer Roads
The iRAP Safety Insights Explorer shines a light on the true scale of road crashes, the safety of the world’s roads, and the positive impact that can be made with investment.

Where we work
- Nearly 223,000 km Roads and Designs Star Rated, along with 91 schools
- Over 1.5 million km Crash rates Risk Mapped
- More than 8,200 people have received iRAP training at events held in Europe, along with nearly 3,000 people who have benefited from iRAP global/on-line trainings and events.
- 52 iRAP Accredited practitioners in 16 European countries
- Over €25.2 billion (USD$27 billion) of road infrastructure investment made safer informed by RAP assessments
- 15 national/regional policies include RAP metrics, including National Road Safety Strategies and Action Plans for Croatia, Greece, Slovenia, Georgia and the UK
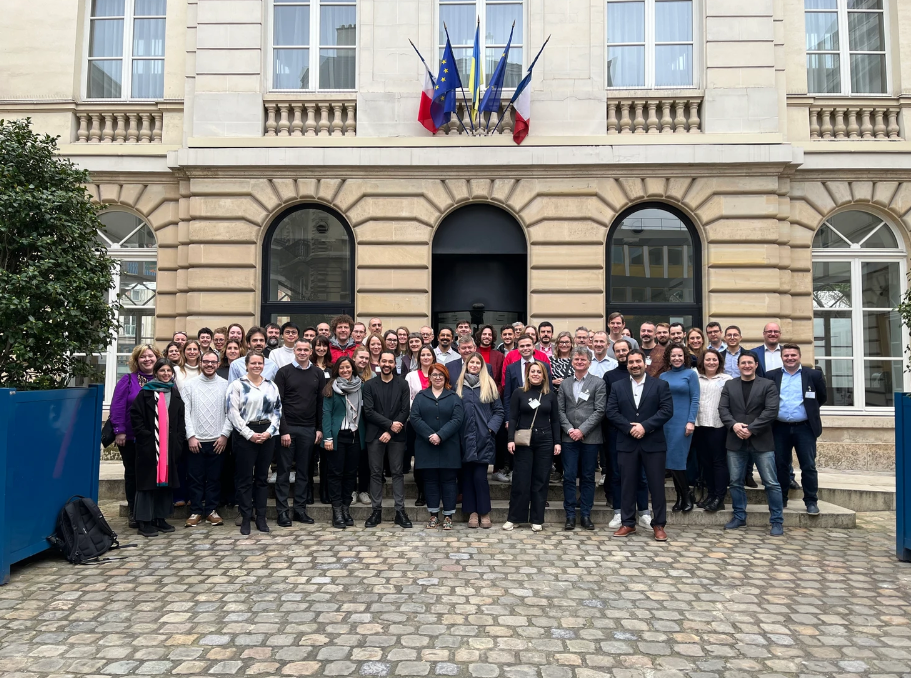
Europe Team

Olivera Rozi
iRAP Safer Journeys Lead for Europe
Click to email

Samar Abouraad
iRAP Safer Journeys Specialist for Europe
Click to email
European Institute of Road Assessment
Visit website

Marko Sevrovic
Senior Road Safety Expert,
European Institute of Road Assessment
Click to email

Alenka Volk
Project Financial Support Manager,
European Institute of Road Assessment
Click to email
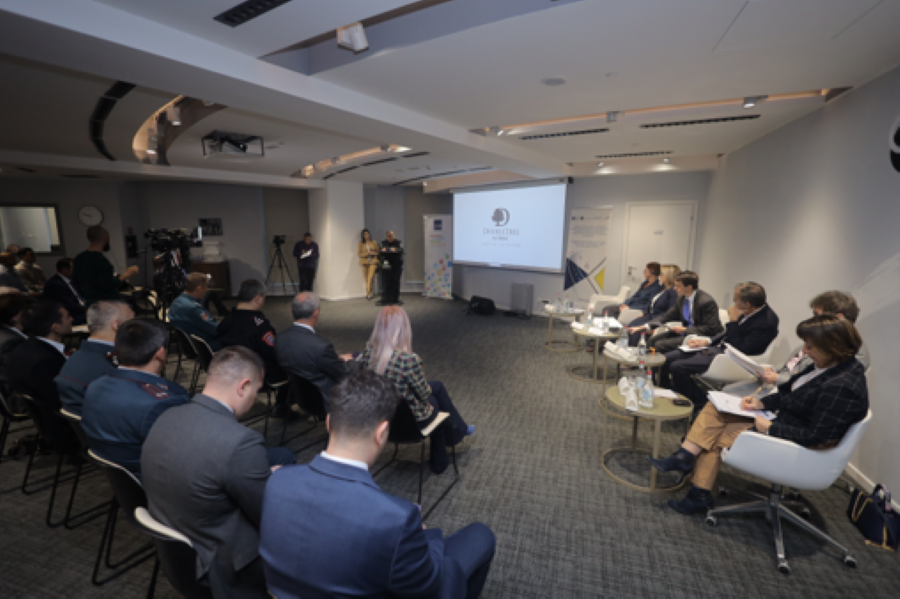
Europe Projects
Showcasing a selecting of multi-country major projects that have occurred in Europe over time. Led by various partners in Europe.
Latest news from Europe


Europe trends – challenges and opportunities